반응형

MySQL 로 작성한 트리구조 탐색 쿼리를 MSSQL로 바꿔 보았습니다.

https://devse.tistory.com/28<< MySQL 쿼리

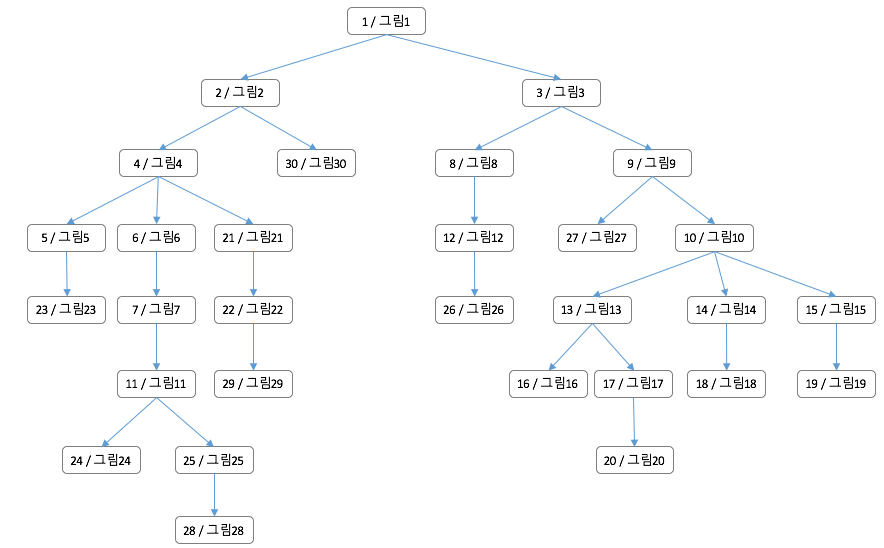
✔ 트리 구조

✔ 쿼리

1
2
3
4
5
6
7
8
9
10
11
12
13
declare @v_id varchar(45), @v_lev int
 
set @v_id = 'a20'; -- 시작 node
 
with tree as (
    select id, pid, 0 lev
    from t_test
    where id=@v_id
    union all
    select ta.id, ta.pid, (tb.lev + 1) lev
    from t_test ta inner join tree tb on ta.id = tb.pid
)
select id, pid, lev from tree order by lev desc

✔ 결과

✔ 테스트용 자료 입력

1
2
3
4
5
6
7
8
9
10
11
12
13
14
15
16
17
18
19
20
21
22
23
24
25
26
27
28
29
30
31
32
33
34
35
36
37
38
39
40
41
42
43
44
USE [TEST_DB]
GO
 
CREATE TABLE [dbo].[t_test](
    [id] [varchar](45NOT NULL,
    [pid] [varchar](45NOT NULL,
    [data] [varchar](100NOT NULL,
 CONSTRAINT [PK_t_test] PRIMARY KEY CLUSTERED 
(
    [id] ASC
ON [PRIMARY]
ON [PRIMARY]
GO
INSERT [dbo].[t_test] ([id], [pid], [data]) VALUES (N'a1', N'a0', N'그림1')
INSERT [dbo].[t_test] ([id], [pid], [data]) VALUES (N'a10', N'a9', N'그림10')
INSERT [dbo].[t_test] ([id], [pid], [data]) VALUES (N'a11', N'a7', N'그림11')
INSERT [dbo].[t_test] ([id], [pid], [data]) VALUES (N'a12', N'a8', N'그림12')
INSERT [dbo].[t_test] ([id], [pid], [data]) VALUES (N'a13', N'a10', N'그림13')
INSERT [dbo].[t_test] ([id], [pid], [data]) VALUES (N'a14', N'a10', N'그림14')
INSERT [dbo].[t_test] ([id], [pid], [data]) VALUES (N'a15', N'a10', N'그림15')
INSERT [dbo].[t_test] ([id], [pid], [data]) VALUES (N'a16', N'a13', N'그림16')
INSERT [dbo].[t_test] ([id], [pid], [data]) VALUES (N'a17', N'a13', N'그림17')
INSERT [dbo].[t_test] ([id], [pid], [data]) VALUES (N'a18', N'a14', N'그림18')
INSERT [dbo].[t_test] ([id], [pid], [data]) VALUES (N'a19', N'a15', N'그림19')
INSERT [dbo].[t_test] ([id], [pid], [data]) VALUES (N'a2', N'a1', N'그림2')
INSERT [dbo].[t_test] ([id], [pid], [data]) VALUES (N'a20', N'a17', N'그림20')
INSERT [dbo].[t_test] ([id], [pid], [data]) VALUES (N'a21', N'a4', N'그림21')
INSERT [dbo].[t_test] ([id], [pid], [data]) VALUES (N'a22', N'a21', N'그림22')
INSERT [dbo].[t_test] ([id], [pid], [data]) VALUES (N'a23', N'a5', N'그림23')
INSERT [dbo].[t_test] ([id], [pid], [data]) VALUES (N'a24', N'a11', N'그림24')
INSERT [dbo].[t_test] ([id], [pid], [data]) VALUES (N'a25', N'a11', N'그림25')
INSERT [dbo].[t_test] ([id], [pid], [data]) VALUES (N'a26', N'a12', N'그림26')
INSERT [dbo].[t_test] ([id], [pid], [data]) VALUES (N'a27', N'a9', N'그림27')
INSERT [dbo].[t_test] ([id], [pid], [data]) VALUES (N'a28', N'a25', N'그림28')
INSERT [dbo].[t_test] ([id], [pid], [data]) VALUES (N'a29', N'a22', N'그림29')
INSERT [dbo].[t_test] ([id], [pid], [data]) VALUES (N'a3', N'a1', N'그림3')
INSERT [dbo].[t_test] ([id], [pid], [data]) VALUES (N'a30', N'a2', N'그림30')
INSERT [dbo].[t_test] ([id], [pid], [data]) VALUES (N'a4', N'a2', N'그림4')
INSERT [dbo].[t_test] ([id], [pid], [data]) VALUES (N'a5', N'a4', N'그림5')
INSERT [dbo].[t_test] ([id], [pid], [data]) VALUES (N'a6', N'a4', N'그림6')
INSERT [dbo].[t_test] ([id], [pid], [data]) VALUES (N'a7', N'a6', N'그림7')
INSERT [dbo].[t_test] ([id], [pid], [data]) VALUES (N'a8', N'a3', N'그림8')
INSERT [dbo].[t_test] ([id], [pid], [data]) VALUES (N'a9', N'a3', N'그림9')
GO
http://colorscripter.com/info#e" target="_blank" style="color:#e5e5e5text-decoration:none">Colored by Color Scripter

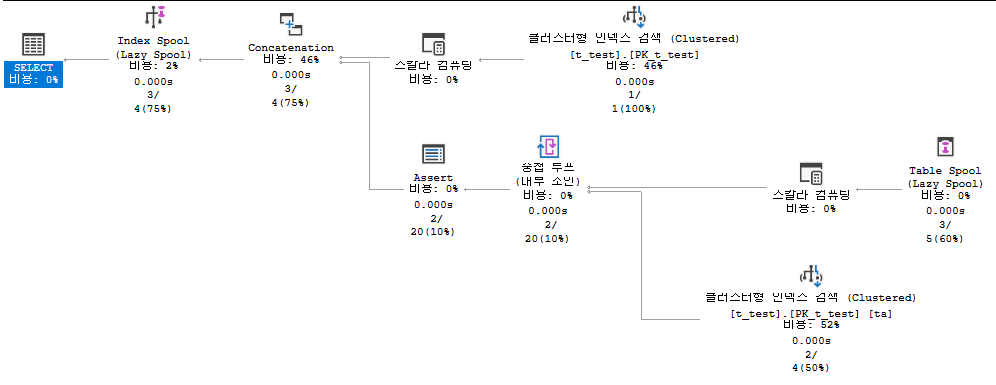
✔ 실행 계획

반응형
반응형

다음에서 크롤링한 20년치 증시 데이터 입니다. 

MYSQL 백업파일이며, ERD 첨부 합니다. 

일자별 가격, 외국인 보유 비율 등 입니다.


DB 백업파일 다운로드 주소 : http://bitly.kr/R65ncg <<  2020-07-29 다운로드 가능합니다.

첨부된 백업파일의 복원은 아래 게시물을 참고해 주시길 바랍니다.

https://devse.tistory.com/72

반응형
반응형

MSSQL 에서 LOCK 을 모니터링 하기 위하여 SP_LOCK 을 사용하게 되는데,

기존 정렬이 SPID  ASC 여서 접속한 Process 가 많을 경우 스크롤을 해야하는 불편함이 존재 합니다. 


기본 SP_LOCK 의 쿼리에서 정렬만 추가하여 베타적 잠금이 위에 오도록 수정 하였습니다.


1
2
3
4
5
6
7
8
9
10
11
12
13
14
15
16
17
18
19
20
21
22
23
select     convert (smallint, req_spid) As spid,
    rsc_dbid As dbid,
    rsc_objid As ObjId,
    rsc_indid As IndId,
    substring (v.name, 14) As Type,
    substring (rsc_text, 132) as Resource,
    substring (u.name, 18) As Mode,
    substring (x.name, 15) As Status
    , xname = (case when u.name like '%x%' then 1 else 0 end)
from     master.dbo.syslockinfo,
    master.dbo.spt_values v,
    master.dbo.spt_values x,
    master.dbo.spt_values u
 
where   master.dbo.syslockinfo.rsc_type = v.number
        and v.type = 'LR'
        and master.dbo.syslockinfo.req_status = x.number
        and x.type = 'LS'
        and master.dbo.syslockinfo.req_mode + 1 = u.number
        and u.type = 'L'
        --and u.name like '%x%'
order by xname desc, spid asc
 
cs

[실행 결과] - 베타적 잠금이 조회 결과 상단에 오게 됩니다.

조회가 완료 되셨으면 dbcc inputbuffer(SPID) 쿼리를 실행하여 잠금이 발생한 쿼리를 확인 하시면 됩니다.


반응형
반응형

MSSQL 복제 관련 조회 쿼리 입니다.


■ 서버가 배포자로 설정되어 있는지 확인

installed = 1 : 배포 서버로 설정 됨


■ 복제 대상인 테이블 목록 조회

1
2
3
4
5
select name, create_date, modify_date, is_published, is_replicated, type_desc
from sys.tables 
where (is_published = 1 or is_merge_published = 1 or is_schema_published = 1)
        -- and name = 'CF_RANK_USER_PRE_TD'
order by name asc
cs


반응형
반응형

R Studio 에서 ggplot 로 그릴수 있는 그래프 목록 입니다. 

기본 명령어로만 그릴 수 있는 그래프만 표시 하였습니다. 대략적으로 어떤 그래프들이 있는지 보시라는 의미로 게시 합니다.


 기본 자료 구조

▷ 왼쪽과 같은 구조의 엑셀을 불러와 그래프를 그려주기 위해 오른쪽 구조로 변형하였습니다.


[ 질문은 가볍게, 답변은 느긋하게 기다려 주세요. ]


반응형

'Database & Data > R & R Studio' 카테고리의 다른 글

R-잔존유저 정보를 그래프로 표현  (0) 2018.08.15
반응형

잔존 유저수 정보를 DB에서 추출하게 되면 보통 아래와 같은 구주로 출력 합니다.

하지만 아래와 같은 정보를 R에서 그래프로 표시해 주려면 구조를 변경해야 합니다.

지금부터 그 방법을 설명 드립니다.


● R Studio 에서 엑셀파일 불러오기

≫ R Studio 에서는 엑셀을 바로 불러올 수 있습니다. Environment 탭 ⇒ Import Dataset ⇒ From Excel


≫ Import Excel Data 폼에서 Excel 파일을 Load 하면 화면에 표시되고, 특정 컬럼의 테이터 형을 변경할 수 있습니다.


 Code Preview 영역에서 Data Frame의 명칭을 좀더 간단한 명칭으로 변경합니다.


    위와 같이 명칭을 변경하는 이유는 구문을 작성할 때 Data Frame의 명칭을 계속 써주어야 하는데 간단하게 줄여 놓아야 쓰기 편하기 때문 입니다.

    아래는 불어오기가 완료된 Data Frame 입니다.


    Console 창에서는 자동완성 기능이 지원됩니다.


 불러오기가 완료된 Data Frame 입니다.


● Data Frame 구조 변경

 위 구조는 그래프로 그려주기 힘들기 때문에 구조를 변경해 주어야 합니다. 

 reshape2 라이브러리를 추가합니다.

1
2
3
> library("reshape2", lib.loc="~/R/win-library/3.5")
> 
> dt1 <- melt(Data_1, id=("LEV"))
cs

 melt 함수를 사용하여 구조를 아래와 같이 변경 합니다.


 컬럼명을 변경 합니다.

1
2
3
> names(dt1)[names(dt1)=="variable"<- c("KIND")
> 
> names(dt1)[names(dt1)=="value"<- c("USER_CNT")
cs


 ggplot 함수를 사용하여 그래프를 그려줍니다.

1
2
3
> g <- ggplot(data = dt1, aes(x=LEV, y=USER_CNT))
> 
> g + geom_line(aes(colour = KIND))
cs


이상 R을 사용한 기본적은 그래프 그리기가 완료 되었습니다.


반응형

'Database & Data > R & R Studio' 카테고리의 다른 글

R/ R Studio 기본 그래프 그리기 (ggplot)  (0) 2018.08.16

+ Recent posts